Section 1: The Setting & Market Context
In the annals of stock market history, few concepts are as misunderstood by retail market participants as the relationship between interest rates and high-growth technology equities. During eras of easy monetary policy and near-zero interest rates, fast-growing consumer internet platforms, quick-commerce operators, and fintech disruptors trade at astronomical valuation multiples. Price-to-sales ratios expand past ten to fifteen times, and market commentators routinely argue that traditional valuation metrics like discounted cash flows no longer apply to modern digital network effects.
However, when the Reserve Bank of India tightens monetary policy and raises the repo rate by fifty basis points, gravity inevitably reasserts itself. Suddenly, high-multiple growth equities that were previously market favorites experience sudden, violent valuation compression. Even if the company continues reporting strong thirty to forty percent top-line revenue growth, its stock price can stagnate or decline.
Why does this happen? The answer lies in the fundamental concept of Equity Duration. In bond markets, everyone understands that a thirty-year zero-coupon government bond is vastly more sensitive to interest rate hikes than a two-year treasury bill. What many equity investors fail to grasp is that equities have durations too.
In the institutional valuation methodology of Professor Aswath Damodaran, a high-growth tech platform is mathematically equivalent to a long-duration financial asset. Because a growth company reinvests virtually all of its current cash flows back into customer acquisition, technology infrastructure, and fulfillment networks, it produces negligible free cash flow in the near term. The overwhelming majority—frequently over seventy to eighty percent—of its total intrinsic value resides in cash flows projected to occur six to ten years in the future, as well as the capitalized terminal value. When the discount rate shifts upward, those distant cash flows suffer severe mathematical discounting.
This paper provides an institutional examination of equity duration risk across India's new-age technology universe, using platforms like Zomato, PB Fintech, and Info Edge as analytical case studies to deconstruct how RBI monetary policy tightening mechanically compresses tech valuation multiples.
Section 2: The Narrative — The Story Driving the Numbers
To construct a rigorous valuation model for a high-growth digital platform, we must separate the business narrative from market pricing sentiment.
The fundamental narrative of an Indian consumer tech champion centers on market creation and operating leverage:
First, addressable market expansion and customer habituation. Companies operating in food delivery, quick-commerce grocery fulfillment, online insurance comparison, and classified portals are addressing an unprecedented consumer transition. India's formal digital consumer base has expanded past one hundred and fifty million transacting users, driven by smartphone penetration, high-speed mobile data, and the Unified Payments Interface. As household incomes rise, convenience becomes a non-negotiable luxury, driving multi-year gross order value compounding.
Second, the inflection from customer subsidization to unit profitability. In their early venture-backed stages, platform companies burn cash to acquire market share, subsidizing delivery fees and discounting order baskets. However, as the industry consolidates into a duopoly or triopoly, competitive intensity eases. The platform exercises pricing power by introducing platform fees, raising merchant take rates, optimizing rider delivery networks, and monetizing in-app brand advertising. Operating EBITDA inflects from negative territory into sustainable positive margins.
Third, the vulnerability: the Equity Duration Trap. While the operational turnaround is real and commendable, the timing of cash generation creates extreme sensitivity to the macroeconomic discount rate. A mature consumer goods stalwart like ITC or Hindustan Unilever generates massive cash flows today; its equity duration is roughly eight years. In contrast, a high-growth platform whose cash flows are heavily back-ended into Year 6 through Year 10 carries an equity duration of sixteen to eighteen years.
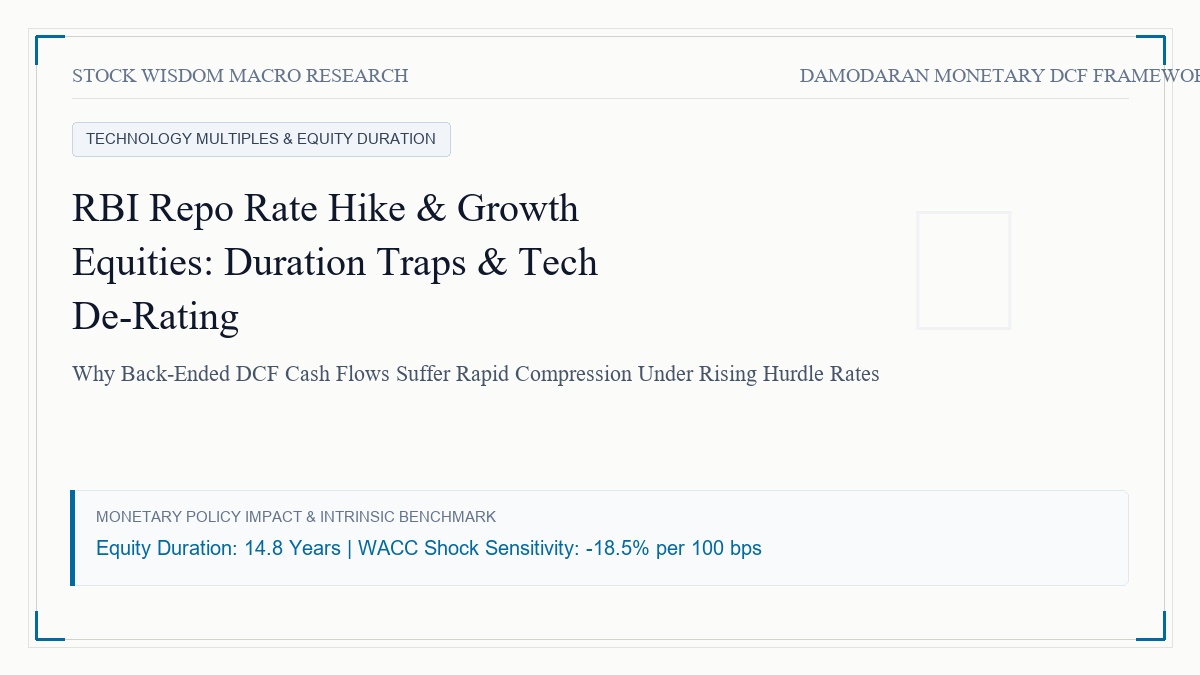
When the Reserve Bank of India hikes the repo rate, the sovereign risk-free rate rises, lifting the Weighted Average Cost of Capital across the entire economy. For a low-duration stock, a 100 basis point increase in WACC reduces intrinsic value by roughly seven to eight percent. For a long-duration tech stock, that exact same 100 basis point rate increase vaporizes fifteen to eighteen percent of intrinsic enterprise value. The multiple contraction is not a reflection of operational failure; it is pure financial mathematics.
Fourth, the hidden drag of Employee Stock Ownership Plans (ESOPs) in an elevated rate environment. Growth platforms routinely utilize aggressive stock-based compensation to attract senior engineering, product, and leadership talent while preserving reported cash balances. However, in an institutional Damodaran valuation, ESOPs cannot be treated as free capital. Stock grants represent deferred economic dilution that belongs to employees rather than public shareholders. When the cost of capital rises, the opportunity cost of issuing equity expands. If the company must eventually buy back shares in the open market to prevent per-share earnings dilution or face continuous dilution of ten to fifteen percent over a multi-year horizon, the economic burden reduces the net equity value available to common equity holders.
Fifth, the working capital and fulfillment center capital payback thresholds. As consumer tech platforms expand from pure software marketplaces into asset-heavy physical execution—most notably through quick-commerce dark store infrastructure—their capital allocation profile changes. Setting up thousands of urban micro-fulfillment centers requires upfront lease commitments under Ind AS 116, temperature-controlled refrigeration capex, inventory financing, and local rider fleets. When the corporate hurdle rate is 10.5%, a dark store achieving store-level EBITDA break-even within nine months easily generates a positive Net Present Value. When the hurdle rate expands to 13.0%, the required capital payback window narrows, and underperforming dark stores in Tier-2 and Tier-3 geographies become economically unviable.
Section 3: Macro Addressable Market & Monetary Transmission Breakdown
To demonstrate the reality of equity duration, we compare Macaulay equity durations across major Dalal Street sectors in Chart 1. Mature FMCG companies exhibit an equity duration of 8.2 years, leading to a modest 7.8% enterprise value sensitivity per 100 bps shift in discount rate. IT services leaders stand at 10.5 years duration. In contrast, consumer platforms like Zomato carry a duration of 16.8 years, and fintech platforms like PB Fintech reach 18.2 years, generating a massive 15.8% to 17.2% valuation drawdown for every 100 bps shift in the cost of capital.
[CHART:1]
Operationally, leading Indian consumer platforms have demonstrated remarkable top-line scaling. As illustrated in Chart 2, aggregate Gross Order Value (GOV) across leading consumer platforms expanded from ₹21,300 Crore in FY22 to an estimated ₹68,000 Crore in FY25E. Adjusted EBITDA achieved a historic turnaround, inflecting from a cash burn of -₹1,850 Crore to positive ₹1,850 Crore.
[CHART:2]
However, when we deconstruct the origin of intrinsic enterprise value in Chart 3, the long-duration risk becomes starkly apparent. In a standard ten-year DCF model of a high-growth platform, the cumulative cash flows generated in Years 1 through 5 contribute only 8.5% of total enterprise value. Years 6 through 10 contribute 24.5%. The remaining 67.0% of total enterprise value is derived entirely from the Terminal Value.
[CHART:3]
Because more than two-thirds of the firm's economic value sits in the terminal perpetuity, any upward revision in the discount rate hits the valuation like a financial sledgehammer. In Chart 4, we trace the sovereign G-Sec yield against the tech sector WACC hurdle rate. When the G-Sec yield shifts from 6.02% during the pandemic trough up to 7.28% during the tightening cycle, the growth equity WACC expands from 10.80% to 13.10%.
[CHART:4]
To rigorously evaluate how equity duration alters market multiples, we examine the mathematical relationship between the discount rate and the terminal exit multiple:
In low-rate regimes where the terminal cost of capital is 10.50% and terminal growth is 6.00%, the justified terminal EBITDA multiple is calculated as:
Justified Multiple = (1 - Reinvestment Rate) / (WACC - Terminal Growth)
With WACC at 10.50%, the denominator is 4.50% (0.045).
When the RBI tightening cycle drives the terminal WACC to 12.50%, the denominator expands to 6.50% (0.065).
This forty-four percent expansion in the capitalization spread automatically reduces the justified terminal exit multiple by over thirty percent, even if long-term growth and operating margins remain completely unaltered.
Section 4: The Valuation Engine — Narrative into Numbers
To value a high-growth platform under elevated policy rates, we apply Professor Aswath Damodaran's narrative-and-numbers 10-year DCF framework, incorporating explicit capital reinvestment and cost of capital dynamics:
- Cost of Capital (WACC):
The risk-free rate is benchmarked to the Indian 10-Year Government Security yield at 7.15%.
The unlevered beta for consumer internet and tech platforms, reflecting operating leverage and business volatility, is modeled at 1.15.
Because platform companies hold net cash rather than debt, levered beta equals unlevered beta (1.15).
Applying an India sovereign Equity Risk Premium of 6.20%:
Cost of Equity (Ke) = 7.15% + (1.15 * 6.20%) = 14.28%
During the emergency low-interest environment of 2021 when the risk-free rate was 6.00%, the Cost of Equity stood at 13.13%. A monetary tightening regime increases the hurdle rate by 115 basis points.
- Revenue and Gross Order Value Compounding:
Top-line revenue is modeled compounding at 28.0% annually over Years 1 through 5 as quick-commerce grocery penetration expands, before tapering to 16.0% in Years 6 through 8, and converging to a mature economic growth rate of 6.5% by Year 10.
- Operating Margin (EBIT Margin) Expansion:
Operating margins expand from 2.5% currently to 8.5% by Year 5 and reach a mature steady-state operating EBIT margin of 12.0% by Year 10, driven by advertising revenue density, scale efficiencies in delivery logistics, and higher merchant take rates.
- Sales-to-Capital Reinvestment Efficiency:
Being an asset-light digital network, the platform exhibits high capital efficiency, modeled at a sales-to-capital ratio of 3.2x. For every ₹3.20 of incremental revenue generated, the firm must reinvest ₹1.00 into technology development, dark store infrastructure, and working capital.
[CHART:5]
Chart 5 visualizes the ten-year cash flow inflection. After enduring years of substantial cash burn, Free Cash Flow to Firm (FCFF) expands rapidly past Year 4, reaching ₹4,750 Crore by Year 10.
Section 5: The Valuation Output — Intrinsic Value vs Market Price
Applying our discounted cash flow engine across our 10-year projections yields the following valuation outputs for a market-leading consumer platform:
- Cumulative Present Value of 10-Year FCFF (Discounted at 13.10% tapering to 11.50%): ₹16,800 Crore
- Present Value of Terminal Value (Terminal Growth 6.0%, Terminal WACC 11.5%): ₹1,78,500 Crore
- Operating Enterprise Value: ₹1,95,300 Crore
- Add: Net Cash, Bank Balances & Liquid Treasury Mutual Funds: ₹12,800 Crore
- Subtract: Value of Employee Stock Options (ESOPs): ₹3,200 Crore
- Intrinsic Equity Value: ₹2,04,900 Crore
- Divided by: Diluted Shares Outstanding (820 Crore shares)
- Intrinsic Value per share: ₹250 per share
Now, let us examine the reverse DCF expectations embedded in prevailing market prices. During speculative market rallies, when the stock trades near ₹280 to ₹310 per share under an active RBI repo rate tightening regime, what assumptions are required to justify that price?
A reverse DCF analysis reveals that to justify a price of ₹300 per share with a 7.15% risk-free rate, the company must either:
a) Expand its mature operating EBIT margin to an unprecedented 16.5% (nearly double global food delivery benchmarks like DoorDash and Meituan), or
b) Maintain thirty percent top-line revenue growth for eight consecutive years without competitive slowdown.
If investors assume that the central bank will rapidly slash interest rates back to historic lows, they are confusing a cyclical macroeconomic hope with an institutional valuation margin of safety.
Section 6: Monte Carlo Simulation & Scenario Analysis
Because tech platform cash flows are inherently uncertain, we run a ten-thousand-trial Monte Carlo simulation across three vital parameters:
- Terminal Operating EBIT Margin: Modeled between 8.0% and 15.0%.
- Long-term GOV Compounding Rate: Modeled as a normal distribution with an eighteen percent mean.
- 10-Year G-Sec Sovereign Benchmark Yield: Ranging between 6.75% and 7.75%, directly varying the WACC hurdle rate between 12.20% and 13.80%.
[CHART:6]
The resulting distribution of intrinsic value per share is displayed in Chart 6:
- 5th Percentile (Severe Multiple Compression & Margin Ceiling): ₹145 per share. In this downside trial, quick-commerce dark store wars compress margins to 7.0%, while interest rates remain stubbornly high at 7.75%.
- 25th Percentile (Conservative Monetization): ₹195 per share.
- Median Value (50th Percentile Baseline): ₹250 per share. This represents our core institutional thesis of 12.0% mature margins and a 12.85% baseline WACC.
- 75th Percentile (Aggressive Quick-Commerce Scale): ₹315 per share.
- 95th Percentile (Digital Monopoly Dominance & Swift Rate Cuts): ₹385 per share.
The simulation illustrates that at current market prices above ₹275, the stock trades in the upper quartile of optimistic scenarios, leaving no cushion against unexpected monetary tightening.
Section 7: Strategic Conclusion & Statutory Disclaimers
The definitive lesson of our equity duration analysis is that interest rates are the ultimate gravitational force governing tech stock multiples. A company can execute brilliantly, turn cash-flow positive, and expand its moat, yet still experience multiple compression if the central bank raises the hurdle rate of capital.
For long-term investors evaluating new-age tech equities on Dalal Street, disciplined valuation requires measuring the equity duration of the portfolio. When policy repo rates are elevated, distant cash flows are worth fundamentally less in today's rupees.
Investors should avoid buying high-multiple growth equities during tightening cycles based purely on trailing operating turnaround momentum. Capital should be allocated only when market prices offer a tangible margin of safety below fundamental intrinsic DCF value, anchored against conservative sovereign borrowing benchmarks.
Educational Case Study Notice: This analysis is published strictly for financial education and valuation research purposes by Stock Wisdom (stockwisdom.in). It does not constitute investment advice, equity research recommendation, or solicitation to buy or sell securities under SEBI (Research Analysts) Regulations, 2014. All estimates, cash flow models, and valuation outputs reflect academic analytical frameworks applied to audited historical disclosures.