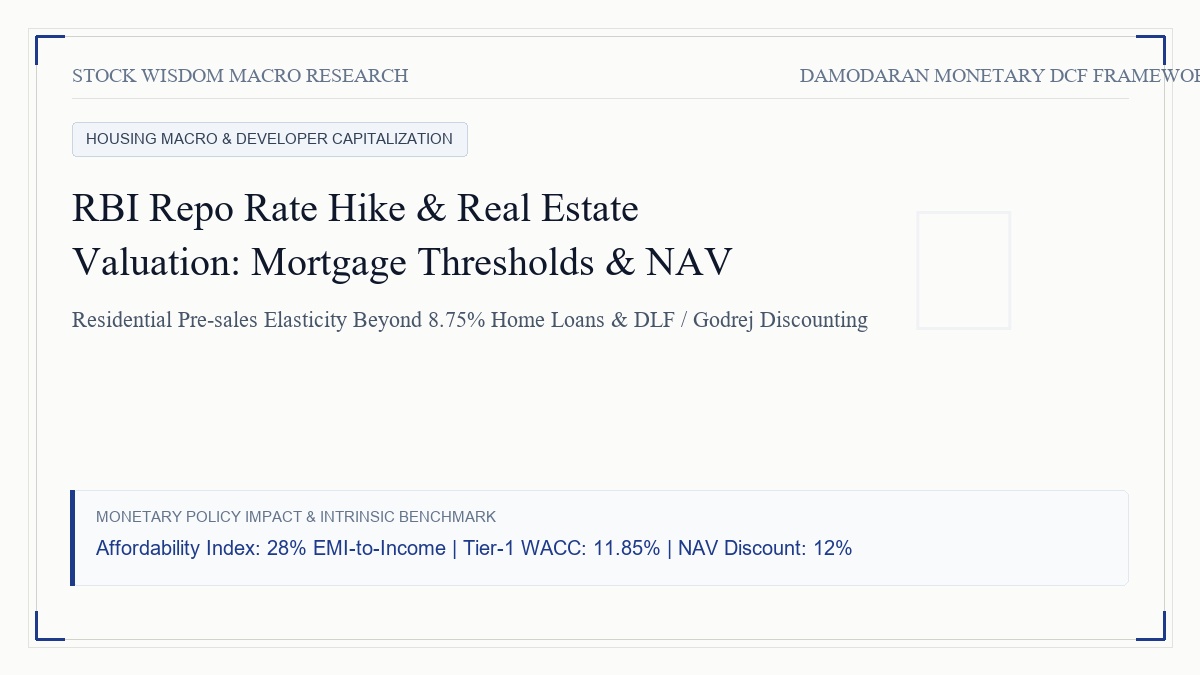
Section 1: The Setting & Market Context
The Indian real estate sector is historically viewed across Dalal Street as the most interest-rate-sensitive asset class in the domestic economy. In standard financial textbooks, real estate developers and property markets are modeled as direct victims of monetary tightening. When the Reserve Bank of India escalates the policy repo rate, commercial banks instantaneously pass on the increase to their external benchmarked retail home loans. Floating mortgage rates rise from seven point zero percent toward eight point seven five or nine point two five percent. Conventional wisdom dictates that rising mortgage burdens must crush buyer affordability, dampen sales velocity, increase inventory holding costs, and spark a severe de-rating across listed developers.
However, during the current multi-year structural cycle on Dalal Street, real estate equities have demonstrated an intriguing paradox. While the RBI increased the policy repo rate by two hundred and fifty basis points over an intensive monetary tightening cycle, pre-sales booking numbers across Tier-1 institutional developers including DLF, Godrej Properties, Prestige Estates, and Macrotech Developers expanded to record historical highs. High-end luxury residential inventory in Gurgaon, Mumbai, and Bengaluru sold out within hours of launch.
This apparent divergence between macroeconomic theory and ground reality demands a first-principles valuation audit. Is the Indian housing market truly immune to monetary policy tightening, or is there a delayed transmission lag that the pricing game is temporarily overlooking? In the valuation framework pioneered by Professor Aswath Damodaran, real estate companies cannot be valued purely on trailing pre-sales momentum or optimistic price-to-earnings ratios. Real estate companies must be valued through a rigorous Net Asset Value and discounted cash flow approach that treats property developments as finite cash flow projects, subject to explicit land holding costs, construction inflation, and discount rates anchored to the sovereign cost of capital.
This dispatch deconstructs the economic mechanics of an RBI repo rate hike on the Indian real estate ecosystem, dissecting the structural divide between affordable housing and luxury real estate, quantifying developer financing friction, and deriving the true intrinsic Net Asset Value of listed real estate leaders.
Section 2: The Narrative — The Story Driving the Numbers
To establish a disciplined valuation model, we must first articulate the underlying economic narrative that explains why the real estate market behaves in this manner and where the vulnerabilities emerge.
The contemporary Indian real estate narrative is bifurcated into two completely distinct consumer realities:
First, the severe vulnerability of the affordable and mid-income housing segment. For a homebuyer purchasing an apartment priced between ₹30 Lakh and ₹60 Lakh, interest rate sensitivity is acute. Such buyers typically finance eighty percent of the property purchase through a twenty-year retail mortgage. A two hundred basis point escalation in home loan rates expands their monthly Equated Monthly Installment from approximately ₹760 per Lakh to ₹900 per Lakh. This pushes the borrower's debt-to-income burden past the critical thirty-five percent threshold, forcing prospective buyers to defer purchases, downsize unit configurations, or exit the formal housing market entirely. Consequently, developers whose cash flows depend on mass-market affordable housing experience severe pre-sales contraction and cash flow compression during rate hike cycles.
Second, the structural decoupling and formalization dividend of the luxury and premium residential segment. In premium and luxury residential projects priced above ₹3 Crore—such as DLF's luxury Camellias and Dahlias towers in Gurgaon or high-end waterfront towers in South Mumbai—the buyer profile is entirely insulated from mortgage sensitivity. These properties are acquired predominantly by affluent corporate executives, successful entrepreneurs, senior professionals, and non-resident Indians who utilize equity market wealth gains, family capital, or business profits. Home loans, if utilized at all, constitute a modest fraction of the transaction value and are frequently taken for tax optimization rather than purchasing power.
Concurrently, a massive formalization wave has swept across Dalal Street. Following the implementation of RERA, the NBFC liquidity crisis of 2018, and post-pandemic consolidation, hundreds of unorganized, leveraged local developers were eliminated. Tier-1 branded corporate developers absorbed dominant market shares. Buyers are willing to pay a twenty to thirty percent premium to buy from developers with fortress balance sheets who guarantee project completion.
However, the valuation danger emerges on the supply side and capital allocation front. While luxury pre-sales remain robust, an RBI repo rate hike directly inflates the cost of acquiring new land reserves, increases capitalized interest during the multi-year construction lifecycle, and fundamentally expands the discount rate (WACC) applied to future project cash flows in an institutional NAV model.
Section 3: Macro Addressable Market & Monetary Transmission Breakdown
To quantify these dynamics, we analyze the systemic mortgage transmission metrics illustrated in Chart 1. When the policy repo rate rises, fresh floating-rate home loans adjust upward with zero transmission lag due to the mandatory RBI External Benchmark Lending Rate framework. On a twenty-year housing loan, an increase in the mortgage rate from 6.75% to 9.00% increases the monthly EMI per ₹1 Lakh borrowed from ₹760 to ₹900.
[CHART:1]
For the aggregate middle-class Indian household earning between ₹8 Lakh and ₹15 Lakh annually, the Affordability Index (measured as monthly EMI divided by net household income) escalates from a comfortable 24.5% to an uncomfortably tight 32.8%. As shown in the green bars of Chart 1, this interest rate escalation causes systemic pre-sales volume growth in the broader housing market to decelerate from 28.0% during low-interest regimes down to a modest 8.5% under active monetary tightening.
However, as depicted in Chart 2, listed Tier-1 developers have defied this aggregate macro deceleration by consolidating market share in the premium and luxury categories. Total pre-sales bookings across the top five listed developers expanded from ₹38,500 Crore in FY22 to an estimated ₹96,000 Crore in FY25E. Operating cash collections followed closely, rising from ₹28,400 Crore to ₹71,500 Crore.
[CHART:2]
The critical question for equity valuation is whether this top-line pre-sales scale translates into sustainable free cash flows when capital costs are elevated. In Chart 3, we dissect the unit economics waterfall of a prime urban residential project. Starting from Gross Realisation of 100%, land acquisition consumes 28.5%, civil construction absorbs 34.2%, and statutory approvals take 6.8%. Crucially, capitalized interest costs and debt financing friction absorb 8.5% of project revenue under an elevated repo rate regime. This leaves a net project operating margin of 22.0%, compared to upwards of 28.0% achievable during low-interest environments.
[CHART:3]
Furthermore, in commercial real estate, rate hikes exert a severe downward gravitational pull on asset valuations. As modeled in Chart 4, Grade-A commercial office capitalization rates expand from 7.25% to 8.40% in tandem with the sovereign ten-year bond yield. Because commercial office valuations equal net operating income divided by the capitalization rate, an eighty-five basis point expansion in cap rates reduces the capital value of office parks by nearly twelve percent unless offset by dramatic rental growth.
[CHART:4]
Section 4: The Valuation Engine — Narrative into Numbers
In institutional equity valuation modeled after Professor Aswath Damodaran's methodology, real estate operating companies cannot be valued like static industrial businesses because their primary assets—land banks and project approvals—are finite inventories that are depleted over time.
The institutional framework for valuing a developer is the Net Asset Value (NAV) Discounted Cash Flow model, supplemented by a Sum-of-the-Parts (SOTP) framework for recurring commercial and rental assets:
Intrinsic Net Asset Value = Present Value of Operating Residential Projects + Present Value of Undeveloped Land Bank - Net Corporate Debt - Capitalized Holding Costs
Let us translate our narrative assumptions into explicit quantitative inputs:
- Cost of Capital (WACC):
The benchmark risk-free rate is pegged to the Indian 10-Year Government Security yield at 7.15%.
The real estate industry equity beta, reflecting project execution risk and cyclical leverage, is modeled at 1.25.
Assuming an Indian sovereign equity risk premium of 6.20%, the Cost of Equity is calculated as:
Cost of Equity = 7.15% + (1.25 * 6.20%) = 14.90%
For developers with debt financing, adjusting for borrowing costs of 9.25% and a 25.17% corporate tax rate yields a Weighted Average Cost of Capital (WACC) of 11.85%. During a low-interest regime when the G-Sec yield was 6.00%, developer WACC stood at approximately 10.20%. A rate hike cycle increases the project discount rate by 165 basis points.
- Residential Cash Flow Phasing:
Pre-sales cash collections are phased across five-year project development cycles using standard S-curve construction milestones: 20% in Year 1, 25% in Year 2, 25% in Year 3, 20% in Year 4, and 10% upon possession in Year 5.
- Land Bank Holding Cost Friction:
Undeveloped land banks cannot be valued at raw current market value. Because undeveloped land produces zero cash flow while carrying property taxes, security expenditures, and financing costs, land reserves planned for monetization beyond Year 7 are discounted at a punitive hurdle rate of 15.0%.
[CHART:5]
Chart 5 illustrates the resulting ten-year Free Cash Flow to Firm (FCFF) trajectory of a diversified real estate developer. While operating cash collections compound steadily to ₹25,200 Crore by Year 10, free cash flow conversion is modulated by land replenishment capex, which requires substantial upfront capital outlays before any pre-sales revenues can be realized.
Section 5: The Valuation Output — Intrinsic Value vs Market Price
Executing our DCF Net Asset Value model across prime real estate holdings reveals how rate hikes reprice intrinsic developer value.
Let us evaluate the baseline valuation output for a representative leading developer with fifty million square feet of residential development potential and prime commercial rent roll:
- Present Value of Cash Flows from Ongoing Residential Projects: ₹34,200 Crore
- Present Value of Future Phase Land Bank Monetization: ₹26,500 Crore
- Present Value of Commercial Rental Annuities (Capitalized at 8.25% Cap Rate): ₹18,400 Crore
- Gross Real Estate Enterprise Value: ₹79,100 Crore
- Subtract: Net Corporate Debt & Lease Obligations: ₹4,800 Crore
- Subtract: Capitalized Corporate Overheads (10 Years Discounted): ₹3,200 Crore
- Total Intrinsic Net Asset Value: ₹71,100 Crore
- Divided by: Diluted Shares Outstanding (77.3 Crore shares)
- Intrinsic NAV per share: ₹920 per share
During periods of speculative euphoria and easy monetary policy, Dalal Street market prices frequently trade at a thirty to forty percent premium to Net Asset Value, with trading prices exceeding ₹1,200 per share. However, under an active RBI tightening stance with mortgage rates anchored above 8.50% and developer WACC at 11.85%, intrinsic NAV contracts to ₹920 per share.
When market momentum bids developer stocks to substantial premiums over NAV during an interest rate tightening cycle, the market is aggressively assuming that:
a) Luxury residential real estate prices will appreciate by ten to fifteen percent annually without dampening demand.
b) Land acquisition costs will remain flat despite intense developer bidding wars for prime urban land parcels.
c) WACC discount rates will rapidly revert back to single digits.
If any of these three heroic assumptions fail, the valuation premium evaporates, and stock prices compress violently back toward intrinsic Net Asset Value.
Section 6: Monte Carlo Simulation & Scenario Analysis
To test the robustness of our valuation under macroeconomic volatility, we run a ten-thousand-trial Monte Carlo simulation across three primary stochastic variables:
- Floating Retail Mortgage Rate: Modeled between 7.75% and 9.75%.
- Annual Pre-Sales Absorption Velocity: Modeled as a normal distribution with an eight percent standard deviation.
- Grade-A Office Capitalization Rate: Varying between 7.50% and 9.00%.
[CHART:6]
The quantitative results of this simulation, illustrated in Chart 6, provide an institutional distribution of intrinsic Net Asset Value per share:
- 5th Percentile (Severe Rate Shock & Luxury Fatigue): ₹680 per share. In this downside scenario, mortgage rates hit 9.75%, mid-income housing freezes, luxury launches face execution delays, and cap rates expand to 9.00%.
- 25th Percentile (Conservative Pre-Sales): ₹795 per share.
- Median Value (50th Percentile Baseline): ₹920 per share. This reflects our baseline thesis of healthy premium pre-sales offset by higher capitalized holding costs and an 11.85% WACC.
- 75th Percentile (Luxury Decoupling): ₹1,065 per share.
- 95th Percentile (Aggressive Land Monetization & Rapid Rate Cuts): ₹1,240 per share.
The simulation reveals that while luxury market resilience protects developers from catastrophic downside, current market prices trading near the 85th percentile of the distribution offer an inadequate margin of safety against sustained monetary tightness.
Section 7: Strategic Conclusion & Statutory Disclaimers
The structural conclusion of our monetary real estate valuation audit is that interest rate hikes execute a profound sorting mechanism across the property market. Rather than generating an across-the-board collapse, an RBI tightening cycle accelerates the bifurcation between unorganized, highly leveraged developers and cash-rich Tier-1 institutional leaders.
While affordable housing demand suffers measurable demand destruction as mortgage burdens cross thirty percent of household income, luxury residential demand remains insulated due to household balance sheet strength and formalization moats. However, equity valuation discipline must account for the reality that higher repo rates mechanically expand developer hurdle rates, increase land bank holding costs, and inflate commercial capitalization yields.
Investors navigating real estate equities on Dalal Street should avoid paying euphoric premiums over Net Asset Value during late-stage monetary tightening regimes. Intrinsic value is best protected by investing in developers that possess debt-free balance sheets, generate strong operational cash collections, hold low-cost historic land reserves, and trade at a measurable discount to their fundamentally derived Net Asset Value.
Educational Case Study Notice: This analysis is published strictly for financial education and valuation research purposes by Stock Wisdom (stockwisdom.in). It does not constitute investment advice, equity research recommendation, or solicitation to buy or sell securities under SEBI (Research Analysts) Regulations, 2014. All estimates, cash flow models, and NAV projections reflect academic analytical frameworks applied to audited historical disclosures.