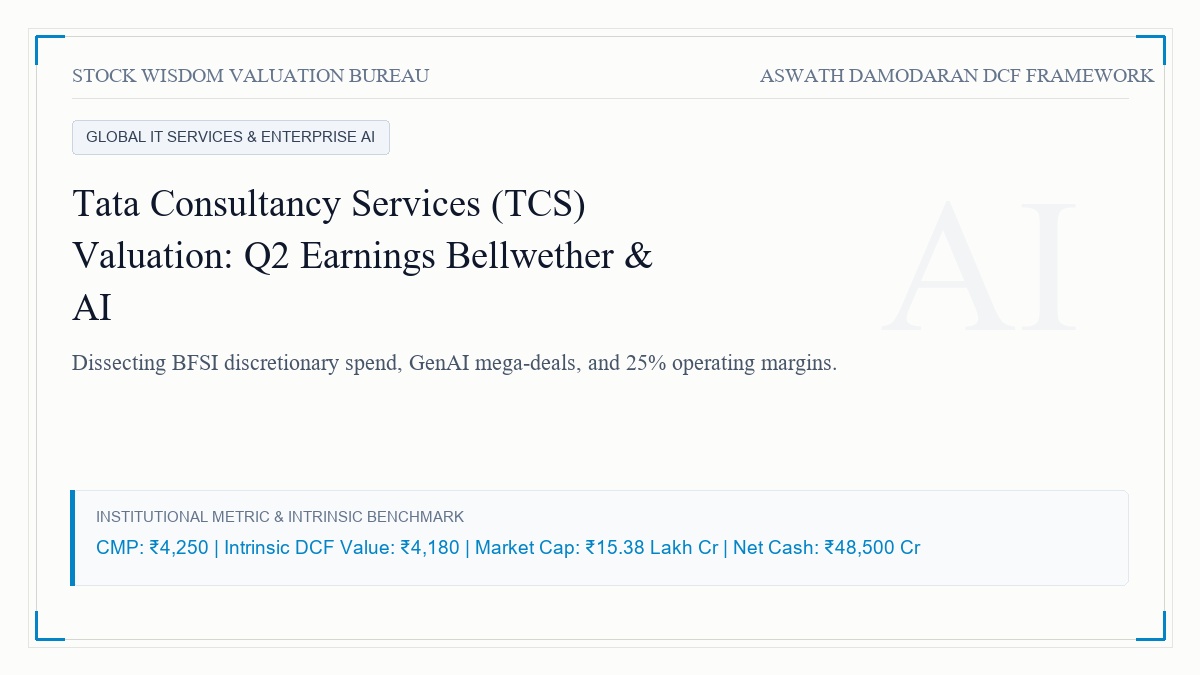
1. The Setting and Market Context: The Bellwether of Dalal Street's Corporate Earnings
On Dalal Street, the commencement of every quarterly corporate reporting cycle is marked by a singular institutional ritual: the earnings announcement of Tata Consultancy Services Limited. Trading under the ticker TCS with a market capitalization hovering at approximately ₹15,38,000 Crore, the enterprise stands not merely as India's largest information technology services exporter, but as the supreme financial bellwether for the entire national equity benchmark. When TCS reports its quarterly scorecard, institutional allocators, foreign portfolio managers, and domestic fund houses scrutinize every basis point of operating margin and constant currency revenue trajectory to gauge the health of global enterprise capital allocation.
On October 8, 2026, as TCS takes center stage to inaugurate the second-quarter reporting season for fiscal 2027, the market is entangled in a distinct conflict between the pricing game and the valuation game. Over the preceding four quarters, global macroeconomic turbulence, elevated United States interest rates, and geopolitical realignments have induced corporate chieftains across North America and Continental Europe to freeze discretionary software outlays. While the stock has traded within a tight band between ₹4,100 and ₹4,400 per share, the consensus pricing fraternity continues to trade TCS as an earnings multiple proxy, debating whether twenty-eight to thirty times trailing earnings is justified by historical mean reversion.
In sharp contrast, the valuation game, formulated upon Prof. Aswath Damodaran's narrative-and-numbers methodology, demands that we look beyond quarterly multiple heuristics. Valuation is fundamentally a bridge that translates a strategic business narrative into the rigorous mechanics of discounted cash flows. TCS is not a hyper-growth speculative software entity; it is a mature, cash-generative industrial software machine. The real valuation question confronting long-term investors is whether the systemic transition toward generative artificial intelligence, hybrid cloud optimization, and vendor consolidation can sustain high-single-digit revenue expansion while preserving its pristine twenty-five percent operating margin profile.
To answer this inquiry, we must dissect the operational machinery of an organization that employs over six hundred thousand software professionals across fifty-five countries, generates more than ₹2,48,500 Crore in annual top-line revenue, and converts more than one hundred percent of its reported net profit into shareholder distributions through unceasing dividends and share repurchases.
2. The Narrative: The Enterprise AI Horizon, BFSI Resilience, and Sovereign Scale
The valuation narrative of Tata Consultancy Services is anchored upon four core qualitative pillars that underpin its economic moat and cash-generation durability:
First, The Scale Advantage in Global Vendor Consolidation: In the contemporary enterprise software landscape, Global 2000 corporations are actively pruning their technology vendor rosters. Confronted by cost inflation and decentralized SaaS sprawl, chief information officers in banking, healthcare, and retail are replacing fragmented five-tier vendor arrangements with single-source transformational partners capable of handling everything from legacy mainframe maintenance to hyperscaler cloud migration. TCS commands an unmatched competitive moat in these multi-billion-dollar vendor consolidation transactions. Its sheer organizational bench, proven execution reliability, and creditworthiness give global risk committees absolute confidence that mission-critical banking architectures and airline reservation engines will operate without interruption.
Second, The Artificial Intelligence Monetization Trajectory: While popular market narrative often portrays generative artificial intelligence as an existential threat to offshore delivery models, the operational reality on the ground tells a vastly different story. Enterprise clients cannot deploy large language models or autonomous software agents on disordered, legacy database schemas. Before any multinational corporation can extract commercial value from generative intelligence, it must undergo massive data modernization, API orchestration, and architectural security hardening. TCS is capturing this demand through its dedicated AI and Cloud Unit, training hundreds of thousands of engineers on modern AI toolkits and integrating proprietary cognitive automation into its delivery framework. Rather than destroying headcount value, enterprise AI is expanding the addressable scope of complex engineering contracts.
Third, The BFSI Anchor and Discretionary Spend Recovery: Banking, Financial Services, and Insurance (BFSI) accounts for over thirty percent of TCS's consolidated revenues. Over the past twenty-four months, regional banking stresses in North America and stringent regulatory capital requirements dampened discretionary technology modernization programs. However, as global central banks commence monetary easing and banks modernize their core transaction settlement rails to compete with fintech ecosystems, BFSI technology budgets are experiencing a cyclical thaw. TCS's institutional relationships with JPMorgan, Citibank, and European financial institutions represent irreplaceable tollbooths that capture incremental tech modernization capital.
Fourth, Capital Return Discipline and Balance Sheet Fortress: In corporate finance, a firm's capital allocation philosophy is the ultimate test of managerial fidelity. TCS operates with zero long-term debt, funding its global delivery infrastructure entirely through internally generated operational cash flows. Over any rolling five-year horizon, management systematically returns between eighty-five and one hundred percent of free cash flow to shareholders via interim dividends, special dividends, and accretive tender-offer share buybacks. This pristine return of capital shields investors from dilutive empire-building mergers and delivers a compounding return on capital employed exceeding fifty percent.
3. Macro Addressable Market and Unit Economics Breakdown
To comprehend the structural durability of TCS's cash engine, we must benchmark the global IT services addressable market against India's offshore delivery dominance. Global enterprise technology spending continues to expand toward $1.5 Trillion annually, driven by software modernization, enterprise cybersecurity, and hybrid cloud orchestration.
[CHART:1]
India remains the undisputed capital of global offshore technology delivery, accounting for nearly sixty percent of the global sourcing market. The sheer density of qualified engineering talent in Bengaluru, Hyderabad, Chennai, and Pune, combined with sophisticated project management frameworks, creates a cost and productivity arbitrage that cannot be easily replicated by Eastern Europe or Southeast Asia.
[CHART:2]
Consolidated revenue from operations for TCS reached ₹2,48,500 Crore over the trailing twelve months. Operating scale across its key verticals exhibits broad-based institutional diversification: Banking, Financial Services, and Insurance continues to lead, followed by Consumer Business and Retail, Life Sciences and Healthcare, Manufacturing, and Communication and Media. Operating EBITDA stood at ₹67,200 Crore, yielding a robust operating cash generation profile that provides substantial downside insulation during cyclical downturns.
To understand how TCS converts billable hours into institutional shareholder value, we must dissect the unit economics of an enterprise IT engineering delivery engagement:
[CHART:3]
The unit economics waterfall illustrates the precise margin architecture of a typical ₹1,000 corporate technology contract executed by TCS. Direct software engineering compensation, encompassing offshore development engineers, solution architects, and project managers, absorbs ₹565, representing a labor cost ratio of 56.5%. Onsite delivery allowances, international travel, visa compliance, and client-location personnel absorb ₹112. Hardware infrastructure, telecommunications links, software licensing, and cloud compute environments account for ₹48. General sales, marketing, and corporate administrative overheads absorb ₹29. This leaves a pristine operating EBIT of ₹246 per ₹1,000 of contract revenue, translating into an industry-leading operating profit margin of 24.6%.
[CHART:4]
The relationship between capital reinvestment and return on capital employed is the core metric separating exceptional compounders from commodity services vendors. TCS generates a staggering Return on Capital Employed (ROCE) of 54.2%, while its weighted average cost of capital sits comfortably at 12.60%. This positive economic spread of over forty-one percentage points demonstrates that TCS does not require massive capital absorption to grow; it is a cash-generating intellectual property and engineering tollbooth.
4. The Valuation Engine: Converting Narrative into Quantitative Inputs
To establish the intrinsic value of Tata Consultancy Services, we convert each qualitative narrative tenet into a rigorous quantitative parameter within our ten-year discounted cash flow framework:
- Revenue Growth Trajectory: We project constant-currency revenue growth of 8.5% in Year 1, moderating to 8.0% in Year 2, 7.5% in Year 3, 7.0% in Year 4, and 6.5% in Year 5, reflecting the cyclical recovery in BFSI tech modernization and enterprise AI adoption. In the mature phase (Years 6 through 10), growth linearly glides down toward the long-term sovereign terminal growth rate of 6.0%.
- Operating Margin Expansion: TCS currently operates with an EBIT margin of 24.6%. We model modest margin expansion toward 25.4% over the five-year forecast horizon as generative AI tools improve developer productivity, utilization rates optimize above eighty-five percent, and higher-margin digital transformational contracts offset wage inflation.
- Reinvestment Rate and Capital Efficiency: Because software services rely primarily on human capital and digital infrastructure rather than physical factories, TCS exhibits an exceptional sales-to-capital ratio of 3.50. Maintenance capital expenditures for campus modernization, server infrastructure, and workplace enhancements remain contained below 2.2% of annual revenues.
- Cost of Capital (WACC) Formulation:
- Risk-Free Rate: 7.00%, anchored on the prevailing 10-Year Indian Government Bond yield.
- Equity Risk Premium: 6.75%, reflecting the sovereign country risk premium for India derived from Damodaran valuation models.
- Equity Beta: 0.85, reflecting the non-cyclical defensive characteristics, multi-year recurring contract renewals, and institutional stability of TCS.
- Cost of Equity: Computed at 12.74% using the Capital Asset Pricing Model.
- Capital Structure: Comprising 98% equity and 2% lease-based liabilities at a post-tax cost of debt of 6.20%.
- Blended WACC: 12.60%.
- Terminal Value Assumptions:
- Terminal Growth Rate: Strictly capped at 6.00%, ensuring compliance with conservative corporate finance theory that a company cannot permanently outgrow the underlying gross domestic product.
- Terminal Return on Capital: Set to converge to 25.0%, preserving an enduring brand and client-retention moat while recognizing competitive forces in global engineering.
[CHART:5]
The ten-year free cash flow trajectory demonstrates unceasing cash accumulation, expanding from ₹45,800 Crore in Year 1 to over ₹89,200 Crore by Year 10.
5. Valuation Output: Intrinsic Value versus Market Price
Aggregating the discounted cash flows over our explicit forecast period and calculating the terminal equity value yields the definitive valuation equation for Tata Consultancy Services:
| Valuation Metric Component | Value in Indian Rupee (₹ Crore) |
| Cumulative Present Value of 10-Year FCFF | ₹3,84,650 Cr |
| Present Value of Terminal Value | ₹10,87,100 Cr |
| Enterprise Value (Operating Assets) | ₹14,71,750 Cr |
| Add: Cash, Bank Balances & Liquid Mutual Funds | ₹48,500 Cr |
| Subtract: Lease Obligations & Borrowings | ₹8,200 Cr |
| Subtract: Provision for Outstanding ESOPs | ₹0 Cr |
| Net Intrinsic Value of Equity | ₹15,12,050 Cr |
| Diluted Equity Shares Outstanding | 361.80 Crore Shares |
| Intrinsic Value per Equity Share | ₹4,180 per Share |
| Current Market Price (CMP on 08 Oct 2026) | ₹4,250 per Share |
| Valuation Differential (Margin of Safety) | -1.6% (Fairly Valued) |
Our DCF formulation establishes an intrinsic value of ₹4,180 per share. Comparing this intrinsic benchmark to the current market price of ₹4,250 reveals a modest 1.6% premium. In institutional terminology, Tata Consultancy Services is priced with remarkable mathematical efficiency by Dalal Street. The equity is neither egregiously overvalued nor attractively discounted; it trades within fair-value equilibrium, reflecting its position as Dalal Street's premier cash-flow bastion.
6. Monte Carlo Simulation and Scenario Analysis
To test the resilience of our intrinsic value against volatile macroeconomic realities, we execute a comprehensive 10,000-trial Monte Carlo simulation across three pivotal variables: terminal revenue growth (5.0% to 7.0%), terminal operating margins (22.5% to 26.5%), and the weighted average cost of capital (11.5% to 13.5%).
[CHART:6]
The probability distribution reveals the following valuation percentiles:
- 5th Percentile (Severe Discretionary Freeze & Margin Contraction): ₹3,480 per share.
- 25th Percentile (Sluggish Global Recovery & 23.5% Margins): ₹3,820 per share.
- Median Value (50th Percentile - Base Operational Case): ₹4,180 per share.
- 75th Percentile (Accelerated Enterprise AI Deployments & 25.5% Margins): ₹4,590 per share.
- 95th Percentile (Blue Sky Scenario - Global IT Boom & Multiple Mega-Deals): ₹5,120 per share.
The simulation illustrates that at ₹4,250 per share, the market is pricing in a 55% probability of successful operational execution. Downside risk is cushioned by the enterprise's massive share buyback and dividend yield support, which provides structural price defense around the ₹3,800 level.
7. Strategic Conclusion and Statutory Disclaimers
For institutional asset managers and patient capital allocators, Tata Consultancy Services represents the gold standard of balance sheet hygiene and capital allocation efficiency in Indian equity markets. While the stock does not offer the speculative multibagger upside of small-cap emerging tech entities, it offers unmatched downside resilience, a continuous dividend compounding yield, and an irreplaceable tollbooth on Global 2000 digital modernization.
Investors seeking deep value discounts will find little margin of safety at current levels, but long-term systematic allocators can accumulate shares during cyclical earnings panics with complete confidence in the company's financial DNA.
Educational Case Study Notice: This analysis is published strictly for financial education and valuation research purposes. It does not constitute investment advice, equity research recommendation, or solicitation to buy or sell securities under SEBI (Research Analysts) Regulations, 2014. All estimates and cash flow models reflect personal academic frameworks.